Click Tracking
Discover how your users interact with your digital products, optimize their experience, and drive exceptional results.
Click Tracking
Discover how your users interact with your digital products, optimize their experience, and drive exceptional results.
Click Tracking
Discover how your users interact with your digital products, optimize their experience, and drive exceptional results.
Optimal performance
Key benefits
Optimal performance
Key benefits
Optimal performance
Key benefits

Improve Usability
Seamlessly identify areas for improvement for your site or app and deliver a frictionless experience that keeps users coming back for more.
Improve Usability
Seamlessly identify areas for improvement for your site or app and deliver a frictionless experience that keeps users coming back for more.
Improve Usability
Seamlessly identify areas for improvement for your site or app and deliver a frictionless experience that keeps users coming back for more.

Increase Engagement
Gain valuable insights into user engagement patterns. Keep users engaged, motivated, and invested in your brand.
Increase Engagement
Gain valuable insights into user engagement patterns. Keep users engaged, motivated, and invested in your brand.
Increase Engagement
Gain valuable insights into user engagement patterns. Keep users engaged, motivated, and invested in your brand.
Boost Conversion Rates
With precise data, you can fine-tune your user journey and guide visitors seamlessly toward conversions.
Boost Conversion Rates
With precise data, you can fine-tune your user journey and guide visitors seamlessly toward conversions.
Boost Conversion Rates
With precise data, you can fine-tune your user journey and guide visitors seamlessly toward conversions.
Deep insights
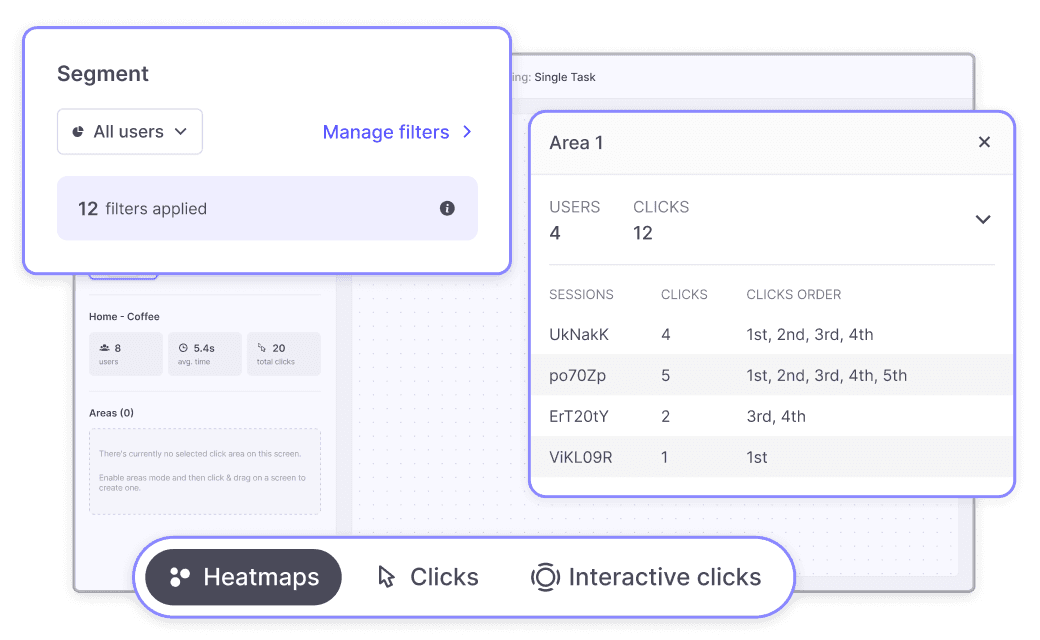
Customize your analysis with segments and filters
Focus on what matters most. Segment and filter your user data to uncover unique insights and create personalized experiences that resonate with different user groups.

Deep insights
Customize your analysis with segments and filters
Focus on what matters most. Segment and filter your user data to uncover unique insights and create personalized experiences that resonate with different user groups.
Deep insights
Customize your analysis with segments and filters
Focus on what matters most. Segment and filter your user data to uncover unique insights and create personalized experiences that resonate with different user groups.
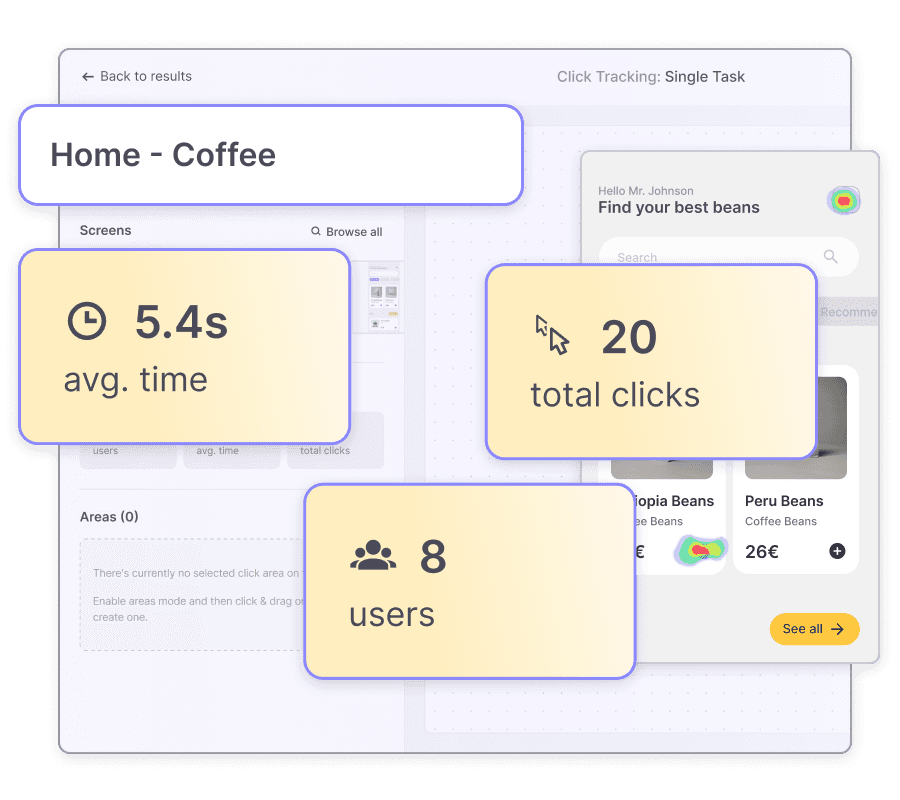
Powerful data
Access in-depth screen statistics
Get key metrics such as the number of users, average time spent on each screen, and total clicks. Uncover patterns and trends to make informed decisions that optimize your user interface and drive meaningful results.
Powerful data
Access in-depth screen statistics
Get key metrics such as the number of users, average time spent on each screen, and total clicks. Uncover patterns and trends to make informed decisions that optimize your user interface and drive meaningful results.
Powerful data
Access in-depth screen statistics
Get key metrics such as the number of users, average time spent on each screen, and total clicks. Uncover patterns and trends to make informed decisions that optimize your user interface and drive meaningful results.
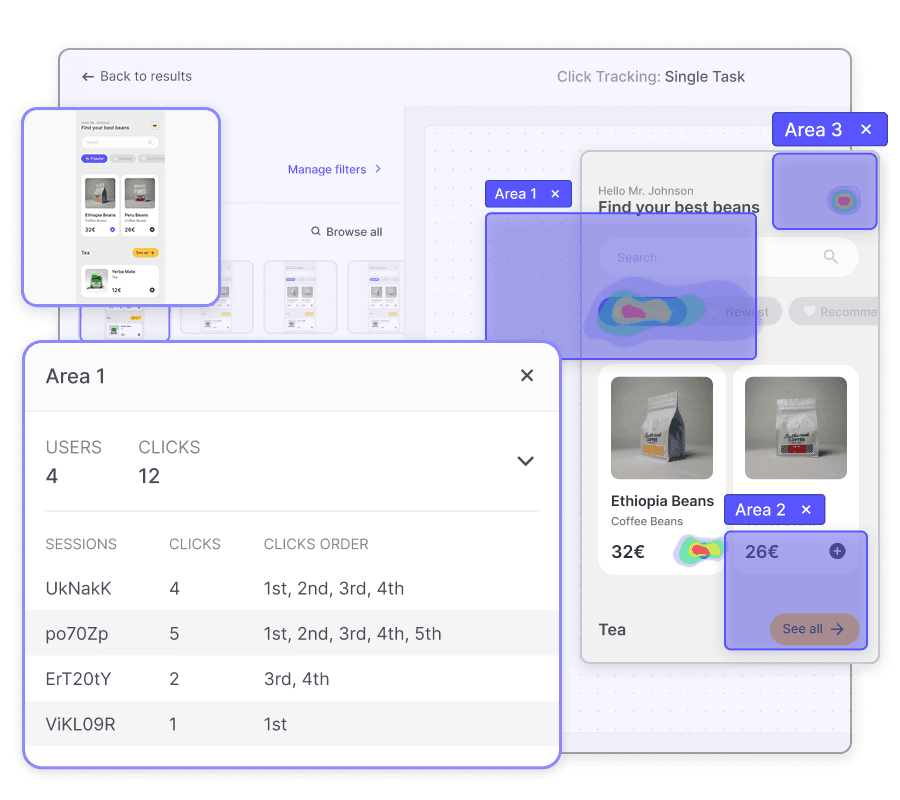
Enhanced information
Track clicks in multiple screen areas
Define the areas of interest that you want to closely monitor and understand. Get detailed metrics on clicks made within each selected region.
Enhanced information
Track clicks in multiple screen areas
Define the areas of interest that you want to closely monitor and understand. Get detailed metrics on clicks made within each selected region.
Enhanced information
Track clicks in multiple screen areas
Define the areas of interest that you want to closely monitor and understand. Get detailed metrics on clicks made within each selected region.
Powerful Click Tracking view maps
Each view provides unique insights that contribute to a comprehensive understanding of user behavior, allowing you to optimize your digital experience with precision.
Powerful Click Tracking view maps
Each view provides unique insights that contribute to a comprehensive understanding of user behavior, allowing you to optimize your digital experience with precision.
Powerful Click Tracking view maps
Each view provides unique insights that contribute to a comprehensive understanding of user behavior, allowing you to optimize your digital experience with precision.
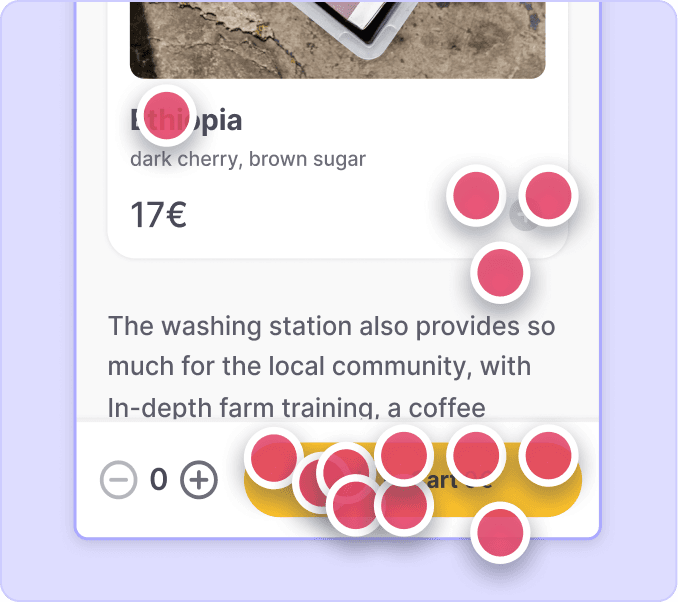
Interactive clicks
Track user interactions with precision on sliders, carousels, hover effects, and more, understanding click locations and navigation within interactive components.
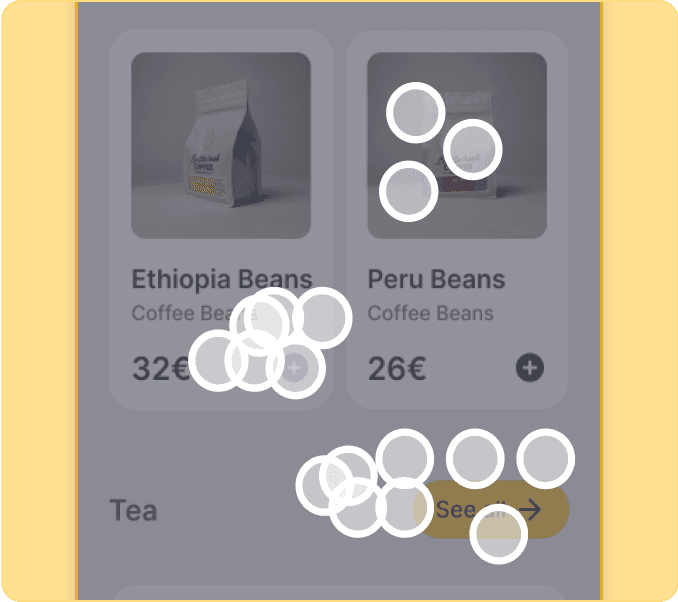
Clicks
Get a granular breakdown of user interactions on a per-element basis. Analyze individual clicks and interactions across your screens to understand user preferences and behaviors.
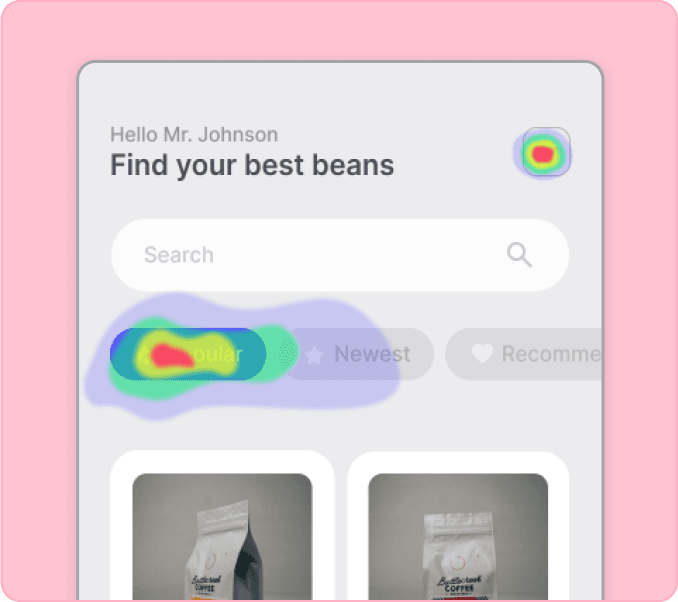
Heatmaps
Gain a visual representation of where users are clicking and how frequently they interact with different areas of your screens.
Create better experiences for your products and services
No credit card required
Create better experiences for
your products and services
No credit card required